Sep 18, 2026
How Do I Verify the Purity of Liposomal Glutathione Powder?
Verifying the purity of liposomal glutathione powder is a measurement problem before it is a documentation problem. You need an assay that separates reduced glutathione (GSH) from its oxidised dimer (GSSG), a sizing method that shows whether the vesicles remain intact, an encapsulation figure you can reproduce, and batch history showing the result is repeatable. This guide sets out the verification actions a technical buyer can specify, and the results to count as a pass. The reference values used here come from our published liposomal glutathione powder specification: GSH 10%–50%, ≥98% retained as the reduced form, encapsulation efficiency 85%–98%, Pb < 0.5 ppm, total plate count < 1,000 cfu/g and a 24-month shelf life, with cGMP, ISO 22000, FSSC 22000, HACCP, Kosher, Halal, Non-GMO and Vegan certification.
What Purity Means in a Vesicular System
In a conventional glutathione ingredient, purity is close to a single number: the percentage of the labelled compound in the drum. In a vesicular system that number has to be split into four claims, each needing its own evidence.
- Identity and potency — how much glutathione is present, and how much remains reduced (GSH) rather than oxidised (GSSG).
- Chemical cleanliness — elemental impurities, residual solvents, microbial load, and any undeclared carrier or diluent.
- Structural integrity — whether the glutathione is genuinely associated with lipid vesicles, and whether those vesicles form a consistent population.
- Reproducibility — whether the second, fifth and twentieth batches behave like the first.
A certificate can state all four and still be unverifiable: the most frequent source of avoidable dispute is an item list without methods, sample preparation or acceptance windows, as this guide to glutathione powder COA content sets out.
The Verification Ladder: What to Test and What Counts as a Pass
Sequence matters. Assay comes first, because a low active content makes every downstream ratio ambiguous; then the redox split, size, encapsulation and the safety items. A single result is interpretable only in the light of the tests before it.
| Attribute | Method | Question answered | Reference window |
|---|---|---|---|
| GSH content | HPLC | Reduced glutathione present | 10%–50% (25% standard grade) |
| Redox split | HPLC, GSH and GSSG calibrated separately | Share already oxidised | ≥98% maintained as reduced (GSH) |
| Particle size | DLS | One stable population? | Mean and distribution profile |
| Encapsulation efficiency | Assay of associated vs free GSH after separation | Active inside the vesicles | 85%–98% |
| Lead | Elemental analysis | Within limit? | Pb < 0.5 ppm |
| Bioburden | Total plate count | Microbial load controlled | < 1,000 cfu/g |
| Appearance | Sensory | Colour, odour, flow | Per specification |
| Stability | Repeat assay and sizing on stored samples | Specification holds in the pack | 24-month shelf life |
The GSH/GSSG Ratio: The Figure Most Files Get Wrong
The reduced-to-oxidised split is the most informative figure in the file and the easiest to get wrong. A specification stating that ≥98% of the active remains reduced is a claim about a ratio, so a ratio must be measured, with both species resolved and quantified separately rather than inferred from a total.
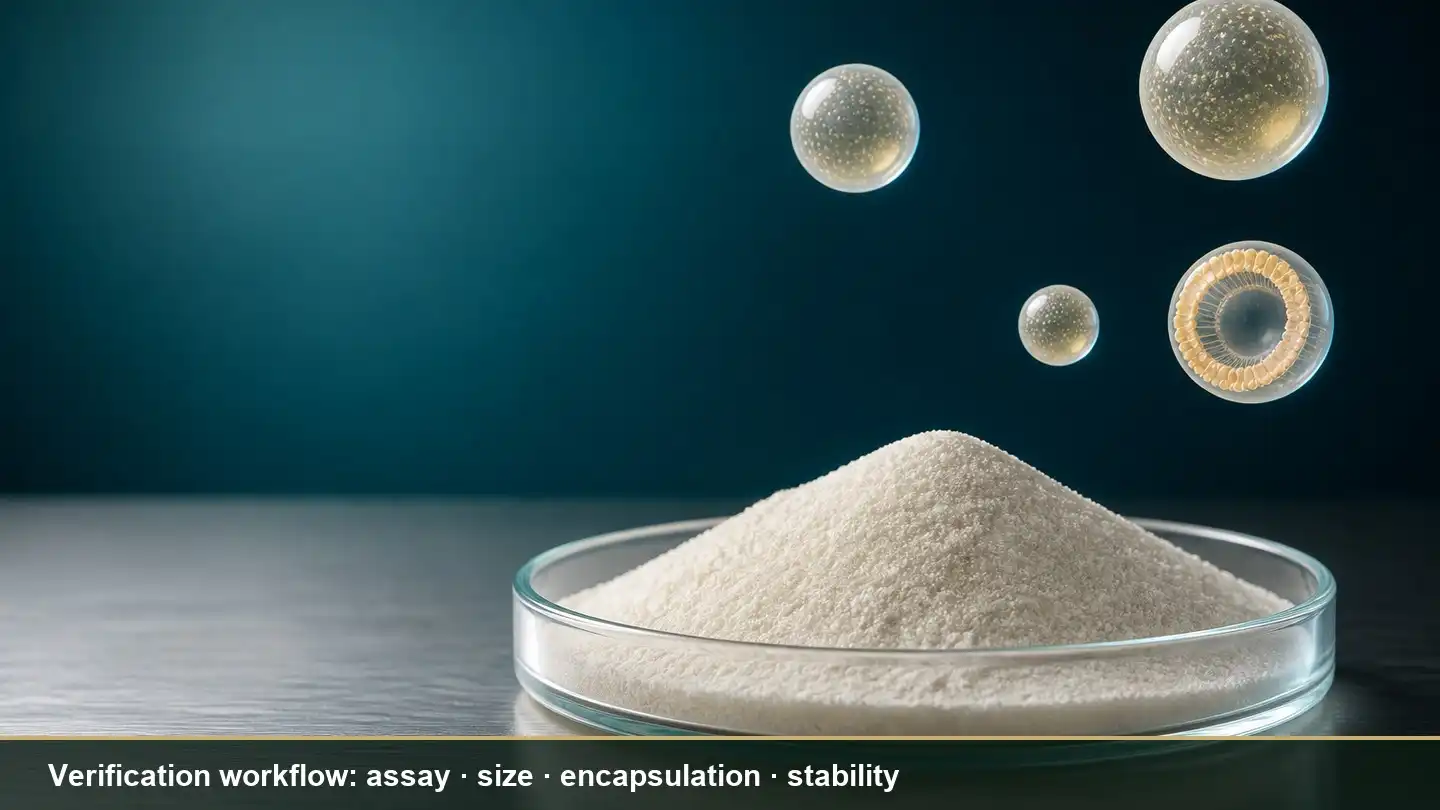
A total-glutathione assay hides the change that matters
GSSG is normally a small fraction of the total, so an assay reporting only the sum is insensitive to progressive oxidation during storage and transport. Four questions do most of the work when reviewing an HPLC method for glutathione: are GSH and GSSG resolved as separate peaks, is GSSG quantified against its own calibration curve, what is the limit of quantification relative to the specification limit, and what happens to the sample between the drum and the column? Method validation should follow a recognised framework such as ICH Q2(R2), which defines the expected evidence for specificity, accuracy and precision.
Pre-analytical oxidation is the dominant distortion
Published work on glutathione quantification is consistent on one point: much of the variation between laboratories originates in sample handling rather than in the detector. Because the thiol group oxidises readily, a fraction of GSH can convert to GSSG before analysis, inflating the oxidised result and depressing the ratio; where GSH exceeds GSSG several hundred fold, roughly 1% artefactual oxidation can bias the measured GSSG by about 150% (Giustarini et al., 2016). The sample-preparation protocol must therefore be documented and repeated identically at every time point, or a rising GSSG trend may reflect the bench rather than the product.
Particle Size by DLS: Read the Distribution, Not the Mean
A mean diameter on its own is a weak acceptance criterion. DLS returns an intensity-weighted result, and intensity scales steeply with particle diameter, so a very small mass fraction of large material can pull the reported size upward. That sensitivity makes DLS useful for catching aggregation early, provided the distribution is read alongside the mean.
What to record from a DLS report
Ask for the distribution plot, the peak position, the polydispersity index, and a repeat measurement after a defined dispersion step. Diluent, concentration and temperature should be stated, because the same powder can give a different distribution in a different medium. A review of DLS in colloidal systems notes that the technique is most reliable for dilute, reasonably uniform populations and becomes hard to interpret in mixed or highly concentrated suspensions; the dispersion protocol therefore belongs in the test record.
Encapsulation Efficiency: How the Figure Is Built and Where It Breaks
The separation step decides the answer
Encapsulation efficiency is a ratio: glutathione associated with the vesicles divided by total glutathione. Both terms come from the same assay, so the figure depends entirely on how cleanly free GSH is separated from vesicle-associated GSH beforehand. Centrifugation, ultrafiltration and dialysis partition the fractions differently, so the separation method and its conditions should be named.
A figure above the band deserves a question, not applause
Against a band of 85%–98%, a result above the range more often signals incomplete removal of free glutathione, or an over-collected vesicle fraction, than exceptional performance. The same caution applies to shelf life: FDA guidance on liposome products covers encapsulation, particle size distribution, in vitro release and leakage across shelf life as related characterisation items, a reminder that an encapsulation figure is only meaningful beside evidence that the active stays associated with the vesicle over time.
When the Numbers Disagree: What Each Failure Pattern Means
Verification is largely pattern reading. Most disputed lots fall into one of these modes.
| Pattern in the data | Most likely explanation | Verification action |
|---|---|---|
| Total GSH low, ratio normal, encapsulation normal | Dilution or grade substitution | Request the blending record; re-assay independently |
| Ratio falling between release and the six-month point | Oxidation in transit or in the pack | Test a retained sample; review headspace and pack format |
| Size growing with a widening tail, encapsulation falling | Vesicle aggregation or leakage | Repeat DLS under a documented dispersion protocol |
| All items in specification but wide batch-to-batch scatter | Process not in control | Review three consecutive COAs and trend plots |
Batch-to-Batch Consistency: The Test a Single Certificate Cannot Pass
One compliant batch proves only that a process can work once. Consistency is what a formulator is buying, and it can be judged only from a series. Ask for the last three to five consecutive COAs and place the values side by side: the spread between batches tells you more than the position of any single value inside its window. Then compare the same parameters across the storage time points of one batch, separating process variation from shelf-life behaviour.
| Parameter | What to compare | Drift worth challenging |
|---|---|---|
| GSH content | Spread between consecutive batches | A step change with no documented cause |
| GSH/GSSG ratio | Trend across batches and storage points | A steady decline |
| Size and polydispersity | Batch mean and spread | A rising index or a second population |
| Encapsulation efficiency | Width of the batch band | A band wider than the specification window |
Packaging and Shelf Life: Verifying Retention of the Reduced Form
A 24-month shelf life is a claim about a specific pack and closure, not about the molecule in general. Verification means asking what was tested in what packaging: whether the headspace is displaced with nitrogen, whether the pouch is vacuum sealed and foil laminated, and whether the pack tested is the pack you will receive. Three questions do most of the work. Which storage conditions and time points support the claim? Was the GSH/GSSG ratio monitored on stored samples, or only the total assay? Was particle size re-measured on stored samples, since aggregation can appear before any change in assay? A defensible design follows a recognised framework: ICH Q1A(R2) defines long-term, intermediate and accelerated conditions, for example 25 °C/60% RH for long-term studies and 40 °C/75% RH for six months under accelerated conditions. A claim supported only by accelerated data should be regarded as provisional, and the handling rules behind it matter as much as the specification figures, as set out in our note on storing liposomal glutathione powder effectively.
Independent Verification and Sampling
Two datasets are better than one only when they are comparable. The most informative test is a retained sample from a batch you already hold, drawn from the sealed pack and analysed both by the supplier's method and by the laboratory's own method: if the two agree, the specification is confirmed; if they diverge, the disagreement localises to the sample or to the method. Before sending material, confirm the laboratory's accredited scope rather than merely its accreditation status, and require raw chromatograms and distribution plots rather than a pass line. Sampling deserves equal care, because powders segregate: increments drawn from several positions in the container are more representative than a single scoop from the surface. Where two suppliers clear the same analytical bar, the remaining differences tend to sit in process control and document discipline, the ground covered by these supplier evaluation factors and by our review of manufacturing quality control for liposomal glutathione; the same logic shapes the shorter judgement described in what a good liposomal glutathione powder looks like.
A Verification Checklist for an Incoming Lot
- Assay: GSH content inside the declared grade band, with the chromatogram attached.
- Ratio: ≥98% of glutathione reported as reduced (GSH), with GSSG quantified against its own calibration.
- Size: mean plus distribution profile from DLS, with the polydispersity index and a repeat measurement on a fresh dispersion.
- Encapsulation: a figure inside 85%–98%, with the separation method named.
- Safety items: Pb < 0.5 ppm and total plate count < 1,000 cfu/g, each linked to the batch number.
- Shelf life: the 24-month claim tied to the pack actually supplied, with storage time points listed.
- Traceability: the batch number on the pack matching the certificate and the retained sample you keep.
- Trend: three to five previous certificates, reviewed for spread and drift rather than for pass or fail.
Requesting Verification Documentation and Samples
If you are specifying liposomal glutathione powder, the productive conversation is about documents rather than adjectives. We can provide a batch certificate of analysis with methods and acceptance windows, the analytical method descriptions behind the GSH/GSSG ratio and the encapsulation figure, representative DLS distribution reports, and a sample for your own laboratory to confirm. Send your target parameters, intended pack format and planned tests to info@emerwell-bio.com, or begin from the liposomal glutathione powder product page.
References
- U.S. Food and Drug Administration. Liposome Drug Products: Chemistry, Manufacturing, and Controls; Human Pharmacokinetics and Bioavailability; and Labeling Documentation — guidance for industry. https://www.fda.gov/regulatory-information/search-fda-guidance-documents/liposome-drug-products-chemistry-manufacturing-and-controls-human-pharmacokinetics-and
- International Council for Harmonisation. ICH Q1A(R2): Stability Testing of New Drug Substances and Products. https://database.ich.org/sites/default/files/Q1A%28R2%29%20Guideline.pdf
- International Council for Harmonisation. ICH Q2(R2): Validation of Analytical Procedures. https://database.ich.org/sites/default/files/ICH_Q2(R2)_Guideline_2023_1130.pdf
- Giustarini D, Tsikas D, Colombo G, Milzani A, Dalle-Donne I, Fanti P, Rossi R. Pitfalls in the analysis of the physiological antioxidant glutathione (GSH) and its disulfide (GSSG) in biological samples. J Chromatogr B. 2016;1019:21–28. https://pmc.ncbi.nlm.nih.gov/articles/PMC4829456/
- Rodriguez-Loya J, Lerma M, Gardea-Torresdey JL. Dynamic light scattering and its application to control nanoparticle aggregation in colloidal systems: a review. Micromachines (Basel). 2023;15(1):24. https://pmc.ncbi.nlm.nih.gov/articles/PMC10819909/
This article covers ingredient characterisation and manufacturing quality controls for a bulk dietary supplement ingredient. It is written for business-to-business technical evaluation and is not medical advice.
Online Message
YOU MAY LIKE
High quality furniture manufacturer
_1776234307158.webp)